I. Spacetime Diagrams
When considering events involving more than one observer, a
very useful device for ``keeping track'' of all observations is the
concept of a spacetime diagram, also called a ``Minkowski
diagram,'' after the physicist who first used this scheme.
We agree to allocate to each observer, say S, a graph with
vertical and horizontal axes. Our observer measures the coordinates
of an event and locates them on the graph.
He uses the
vertical axis as a ``coordinate axis" for the values of
ct for any event, as measured by S.
He uses the horizontal axis as a
``coordinate axis'' for the values of x for the same event, also of
course measured by S. This gives each event some point on the graph.
[Since space really is 3-dimensional and not just 1-dimensional,
occasionally we will need more than one dimension
of the sort we usually think of as space. In such a case we
would also put y and z here, all perpendicular to the vertical axis
and, of course, perpendicular to each other.
For two spatial coordinates
this is only difficult and we will have to do it occasionally.
In the case of needing three spatial coordinates it is impossible
to draw; therefore, in those cases we will simply have to imagine it.
They will probably not ever be needed.]
The worldline of an object is the set of all events at which
that object is present. For instance, our observer, S's worldline
is simply the vertical axis. Any object that S measures to be
at rest will also have a vertical worldline, through, in general,
some other point on the horizontal axis. An object that S measures
to have constant velocity
v will have a worldline that is straight but slanted at some angle.
Since
v = dx/dt = c(dx/c dt), the
slope of that object's worldline will be c/v, i.e.,
the tangent of the angle, ![]() ,
that the line makes with the
horizontal axis will be such that
,
that the line makes with the
horizontal axis will be such that
| (1) |
The worldline of an object that is not moving at constant velocity, i.e.,
is accelerating, will not be a straight line, but will curve according
to the acceleration. However, since no object may move at a speed greater than c,
at all times the worldline of an object makes an angle with the
horizontal that is greater than or equal to
![]() . Of course
we have equality only when the object is allowed to move at speed c,
which mean that it would have zero mass, such as light.
. Of course
we have equality only when the object is allowed to move at speed c,
which mean that it would have zero mass, such as light.
Now consider the horizontal axis (or x-axis) of our observer S's
Spacetime diagram. Those points correspond to all those events
which S measures to have occurred at the time t=0; we may
describe those events as a line of simultaneity for S.
Another line of simultaneity for S would be any other line parallel
to the x-axis, such as the line indicating all those events which
occurred at, for instance, t = 2 nanoseconds, or, if you prefer,
ct = 0.6 meters. The relationship between these two lines, i.e.,
these two lines of simultaneity for S is the same as between
two worldlines of objects both of which S measures to be at rest.
We now need to broaden our ``horizons,'' and
consider how S would describe quantities measured by
another observer, S',
who we take to be moving at some speed 0 < v < c.
For simplicity, we assume
that our two observers have synchronized their clocks
and their (spatial) origins; i.e., they passed one another and
both set their clocks to zero at that time. Therefore,
we know that her worldline is
a line through the origin with a slope of c/v. We know this simply
from our understanding of worldlines. However, it is interesting to
see it in a more algebraic way. Surely we also agree that the
worldline of S' corresponds to the set of all events for which
x' = 0. However, the Lorentz transformation equations tell us that
![]() .
Therefore we can immediately see that the location
x'=0 corresponds to the graph x = vt, or, since we have ct plotted
along the vertical axis, the equation should be given in the form
ct = (c/v) x. This is indeed a straight line (through the origin)
with slope c/v, as expected. Since this line is indeed the worldline of
the observer S', we could also consider this line, the worldline of S', as the ct'-axis; i.e., it is the
set of points along which the values of ct' vary while the values of x'remain fixed, and fixed at x'=0. It would therefore be reasonable that
lines parallel to this axis correspond to worldlines of objects that
S' measures to be at rest, in her frame; i.e., they would have
fixed, but non-zero, values for x'.
.
Therefore we can immediately see that the location
x'=0 corresponds to the graph x = vt, or, since we have ct plotted
along the vertical axis, the equation should be given in the form
ct = (c/v) x. This is indeed a straight line (through the origin)
with slope c/v, as expected. Since this line is indeed the worldline of
the observer S', we could also consider this line, the worldline of S', as the ct'-axis; i.e., it is the
set of points along which the values of ct' vary while the values of x'remain fixed, and fixed at x'=0. It would therefore be reasonable that
lines parallel to this axis correspond to worldlines of objects that
S' measures to be at rest, in her frame; i.e., they would have
fixed, but non-zero, values for x'.
Utilizing that algebraic approach,
we may now inquire as to the shape of a line of simultaneity for this
new observer S'. Taking, for instance, the time t'=0, this line of
simultaneity must correspond to all the points that have t'=0. However,
again, the Lorentz transformation equations tell us that
![]() .
Setting t'=0 gives us the equation
ct = (v/c) x, which is a straight line (through the origin) with the
``opposite'' slope, i.e., with
.
Setting t'=0 gives us the equation
ct = (v/c) x, which is a straight line (through the origin) with the
``opposite'' slope, i.e., with
![]() .
If the worldline
of S' makes an angle
.
If the worldline
of S' makes an angle ![]() with respect to the ct-axis--with
with respect to the ct-axis--with
![]() ,
then the t'=0 line of simultaneity also makes an angle
of
,
then the t'=0 line of simultaneity also makes an angle
of ![]() ,
but with respect to the x-axis. Again, since this line
corresponds to all the events which have t'=0, but which have varying
values of x', we may consider it as the x'-axis. Then, lines
parallel to this line, i.e., parallel to the x'-axis, would be other
lines of simultaneity, with fixed, but non-zero, values for t'.
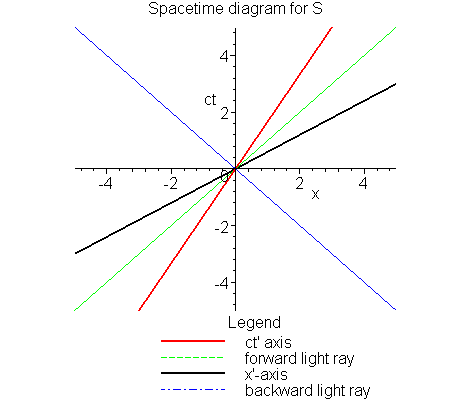
We may summarize the statements above as follows:
,
but with respect to the x-axis. Again, since this line
corresponds to all the events which have t'=0, but which have varying
values of x', we may consider it as the x'-axis. Then, lines
parallel to this line, i.e., parallel to the x'-axis, would be other
lines of simultaneity, with fixed, but non-zero, values for t'.
We may summarize the statements above as follows:
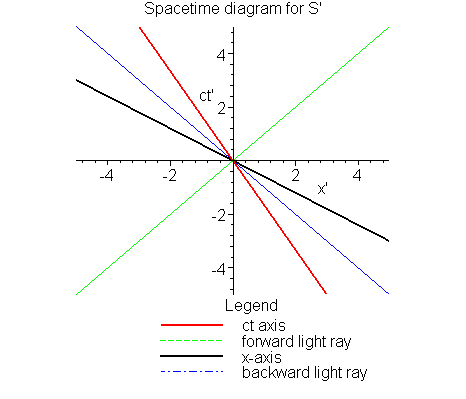
It would be reasonable to ask what does the Spacetime diagram for S' look like, and, in particular, what do the axes of the observer S look like on that diagram. From the point of view of S' the observer S is moving with constant speed, -v. Therefore we may use the inverse Lorentz transformations to determine quickly what these axes look like, in S'-land:
Now, we come to the most perplexing feature of Spacetime diagrams,
unfortunately. If we consider, for instance, time passed in frame
S', we know that since S' is moving her time should move less rapidly
than time as
measured in S. However, now we look at the graph of
S's Spacetime diagram. Since the graph of the ct'-axis, i.e., the
worldline of S', is slanted, what appears to be
the ``distance'' along that slanted line
would be longer than a corresponding distance along the vertical line
which is the worldline for S.
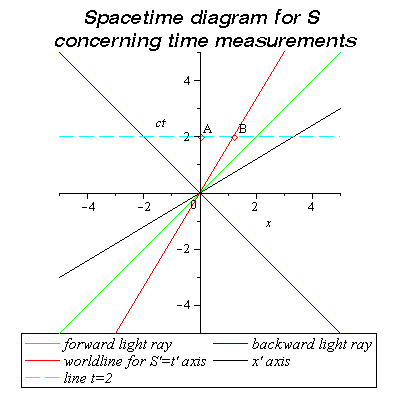
Let us be more precise. We first look at the event where S is 2 hours older than he was when the origin was established, i.e., the event on the ct-axis marked by the symbol 2. (For convenience we will label this event as A, on the figure shown below.) Then we draw a line parallel to his x-axis through this point, i.e., a horizontal line through the point (x,ct) = (0,2). This line constitutes a line of simultaneity for S, of all events that he measures as happening at exactly the same time as his being 2 hours older. This cuts the worldline for S' at a point satisfying x=(v/c)t, the equation for the worldline belonging to S'. We will label this event as B.
![\begin{eqnarray*}x' = \gamma(x - v t)& = & 1.25[1.2 - .6(2)] = 0\;,\\ [2pt]
t' = \gamma(t - vx/c^2)& = & 1.25[2 - .6(1.2)] = 1.6 \hbox{~hours.}
\end{eqnarray*}](img29.gif)
This result is nonetheless in rather strong disagreement with what we might have expected by simply ``looking at'' the Spacetime diagram that S has constructed. On the piece of paper for that diagram, we see event B as lying along this slanted line from the origin and therefore ``obviously'' further away from the origin than event A. The fact that this ``obvious result'' is in disagreement with our calculations is the source of our difficulty. Of course our ``obvious'' perceptions are based on our use of the usual, Pythagorean method of measuring distance, via the length for the hypotenuse of a triangle. However, in this case, that triangle has one ``leg'' which is a spatial distance, and another ``leg'' which is a temporal distance, i.e., a time. Even though we have multiplied that time by the constant c to make the units the same, they are still quite different concepts. Therefore, in fact we have no justification for believing that we may still use the (Pythagorean) rule for calculation of the lengths of hypotenuses to obtain a true measure of distance. Since the diagram is drawn on a piece of paper where we usually deal with x and y, rather than x and ct, our eye is misled. We may certainly rephrase this difficulty in the following way:
II. the (Lorentz) Invariant Interval
A very important feature of ordinary distance is its property
of invariance under changes of observer. It is this property
that we can
still preserve in our Spacetime diagram when we are composing
quantities involving both spatial distances and temporal distances.
To begin, let us first describe the invariance of ordinary
spatial distances, considering only
2-dimensional
geometry, where we know that Pythagoras' Theorem is true. We then consider
two different observers--both at rest--but with different
choices of coordinate axes--say, rotated one with respect to the
other. For some pair of locations, these observers measure
different values for the x-coordinates and the y-coordinates of
the two locations being considered. Nonetheless, they still
agree on the
value of the distance between the two locations. This is a
reason that
distance is so important, namely that it is a quantity that is
independent of the particular observer who measures it, even
though this those observers measure different values for the
respective coordinates.
The (relativistic, invariant) interval is a generalization of the
usual (Pythagorean) distance between two points which takes proper
care of the fact that there is a distinct difference between
spatial coordinates and temporal coordinates. For any
pair of events, the following function of the
coordinate differences between them is independent of the choice of
(inertial) observer:
| (2) |
Because of the minus sign in the definition of the interval, for
different
pairs of events, it can be positive, zero, or negative, although
every observer in
every reference frame will agree on that value! Since there are these
various possibilities, they
each have a name attached, and we will now discuss each one briefly: spacelike, lightlike, and timelike. [This important notion is not
discussed in your text.]
We can now use the interval to create a new method to visualize
its values on a Spacetime diagram. Let us return to the consideration
of point A and B on the Spacetime diagram that belongs to S. Point
A had the coordinates
(x,ct) = (0,2). Therefore the value of the
interval (relative to the origin) for that point is just
02 - 22 =
-4 (light-hours)2. There is then a hyperbola that we may draw
on the spacetime diagram that goes through that point, namely
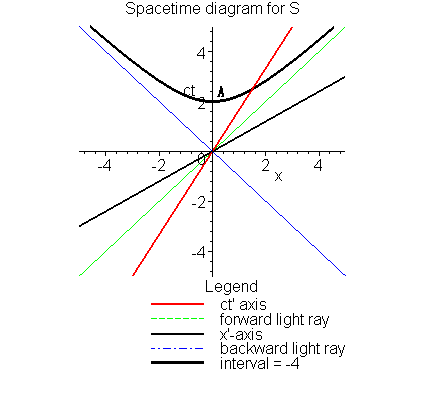
Not only does the second equality tell us that all observers will
agree on this value for that point, but it will allow us to calibrate
distances along the worldline (and lines of simultaneity) for S'.
The point at
which this hyperbola intersects the worldline for S' is a third
point to consider. We will label it event C, and notice that it lies
further along that worldline than did our earlier event B. Since
event C lies on the worldline for S', then it has x'=0;
since it also lies on the hyperbola for the interval
![]() then it must have ct' = 2 hours.
So event C is that particular event where this other observer, S',
has aged 2 hours since the earlier meeting of S and S'.
Looking just at the line on the
piece of paper, between the origin and event C,
that line appears to be longer than the line between the
origin and event A, which is where S had aged 2 hours since their
meeting. Therefore, we see that our perception of distances on the
piece of paper is NOT particularly well related to actual distances
measured by our different observers. Instead, we may use the
hyperbolae generated by constant values of the invariant interval
to create scales for our perception of distance.
then it must have ct' = 2 hours.
So event C is that particular event where this other observer, S',
has aged 2 hours since the earlier meeting of S and S'.
Looking just at the line on the
piece of paper, between the origin and event C,
that line appears to be longer than the line between the
origin and event A, which is where S had aged 2 hours since their
meeting. Therefore, we see that our perception of distances on the
piece of paper is NOT particularly well related to actual distances
measured by our different observers. Instead, we may use the
hyperbolae generated by constant values of the invariant interval
to create scales for our perception of distance.
Quite a different interpretation may be made if we switch to the Spacetime diagram for S'. On this diagram, we may locate the event C, which is where she had aged 2 hours since their origins coincided. We may then draw the same hyperbola as before through this point, but now we draw on the Spacetime diagram for S'. It intersects the worldline for S at the point A.
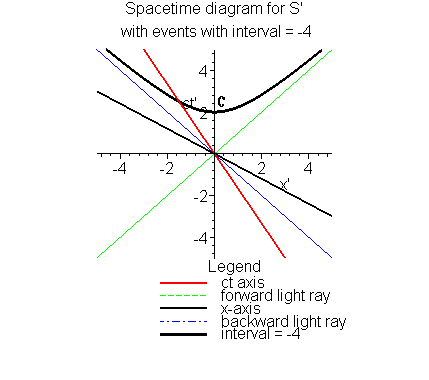
On this diagram we may also draw a line of simultaneity for S',
i.e., a line parallel to her x'-axis and through event C. We
easily see that it
intersects the worldline of S at an earlier point,
which we now call D.
At the point D, S is clearly younger than at the point A, since it
occurs earlier on his worldline; therefore,
as measured by S', the observer S
is younger than she is. From the general principles, this is consistent
since, after all, she measures S as moving!
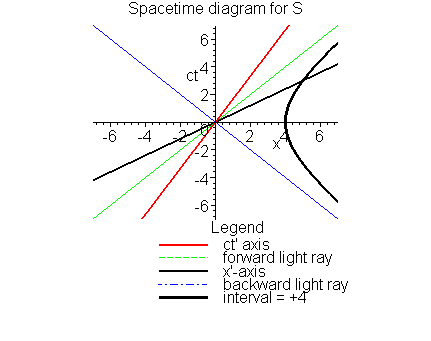
The interval may also be used to determine calibrations for distances
along curves which lie in the spacelike region of spacetime.
An important example of this is a set of points that are measured as
simultaneous by some particular observer, usually moving as seen by
our initial observer, S. We begin with a point on
S's x-axis,
which is, say, 10 meters away from the origin. As measured by S',
this point has an interval with value
![]() ,
since it is simultaneous with the origin as he measures it.
Therefore, if we now consider the hyperbolic curve
,
since it is simultaneous with the origin as he measures it.
Therefore, if we now consider the hyperbolic curve
III. Use of light rays to further determine distances
In this section we first recall that S and S'
have coordinated
their origins and synchronized their clocks, and that S has
measured the velocity of S' to be v = 0.6c, from which he calculates
that her relativistic factor is
![]() .
At this time,
they arrange that they will send light rays (electromagnetic signals)
to one another, and keep good records of when these signals were
received, and sent. Our observer S'
sends out a light ray
(backward) toward S when her clocks tell her that it has been
1 year since they met. We call that event A, and it obviously
has coordinates x' = 0 and
ct' = 1 year. Using the Lorentz transformation equations, we may
also determine its coordinates as measured by S:
.
At this time,
they arrange that they will send light rays (electromagnetic signals)
to one another, and keep good records of when these signals were
received, and sent. Our observer S'
sends out a light ray
(backward) toward S when her clocks tell her that it has been
1 year since they met. We call that event A, and it obviously
has coordinates x' = 0 and
ct' = 1 year. Using the Lorentz transformation equations, we may
also determine its coordinates as measured by S:
Immediately
S sends back a light signal to S',
saying that the signal has been received. Of course S'
has been
traveling further away all this time, so this (second) light ray will
have further to travel than did the one coming the other way.
There
are several different ways to calculate how long this second light
ray will take. Let us use the following approach. Knowing that
event B is 1.5 lt-yrs away from S',
and that it occurred at
ct' = 2.5 lt-yrs, we may simply follow it back, at the speed of
light, to the location of S', which is always fixed at x' = 0.
Having traveled for 1.5 years to arrive back there, the
event, C, of its reception will have primed coordinates x' = 0 and
ct' = 4 lt-yrs. Transferring, now, one last time back to the
coordinates used by S, we may calculate
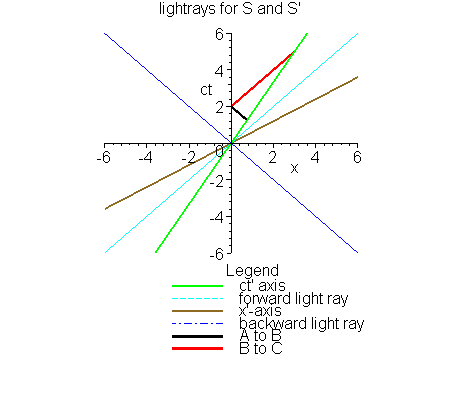
[On the graph, points A, B, and C are not labeled. But the short (black)
lightray travels from A (backward) to B, while the longer (red) lightray
travels from B (forward) to C.]
At this time S'
has aged 4 years and has arrived at a place that
S measures to be 3 lt-yrs away, it having of course taken her
5 years as measured by S. This is the end of this particular
episode.
Daniel Finley